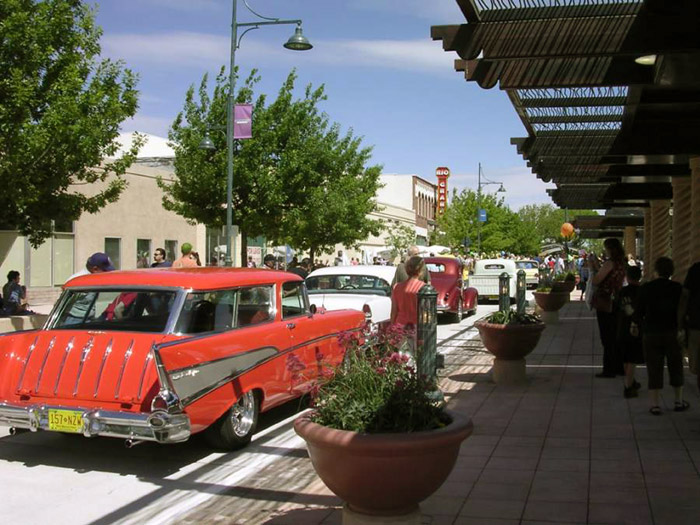
Las Cruces, NM is using Soofa Pro data to transform its downtown public spaces

Dots represent relative pedestrian activity levels within about a 150 foot radius of each bench and core location. They do not represent actual people in space, but instead are designed to illustrate general patterns of downtown activity.
Animation reveals downtown activity levels in Las Cruces at key intersections along Main Street
By visualizing a 24 hour period we can see patterns of pedestrian activity emerge. July 20th was a Thursday; the downtown is most active during lunch and the early afternoon, then foot traffic tapers off in the early evening.
While this is only a very small sample size, a moment in time, it does highlight one of the key goals that the City of Las Cruces has in working with Soofa. The goal is to understand activity levels downtown, particularly after 5pm, to ultimately test strategies that generate more economic activity in the evening hours.
One example of how this goal will be achieved is that the baseline data collected by our sensors will be used to evaluate the impact new businesses opening downtown have on overall pedestrian activity - and to share with businesses to convince them to stay open later. They currently close on the early side for fear of not having enough customers to justify the added cost of remaining open.
What happens in one location downtown influences activity levels elsewhere; measuring the ripple effect and more
The team from the City of Las Cruces not only wants to know what happens at one location or in one moment in time, but also how certain activities or new developments have a ripple effect across the entire downtown core.
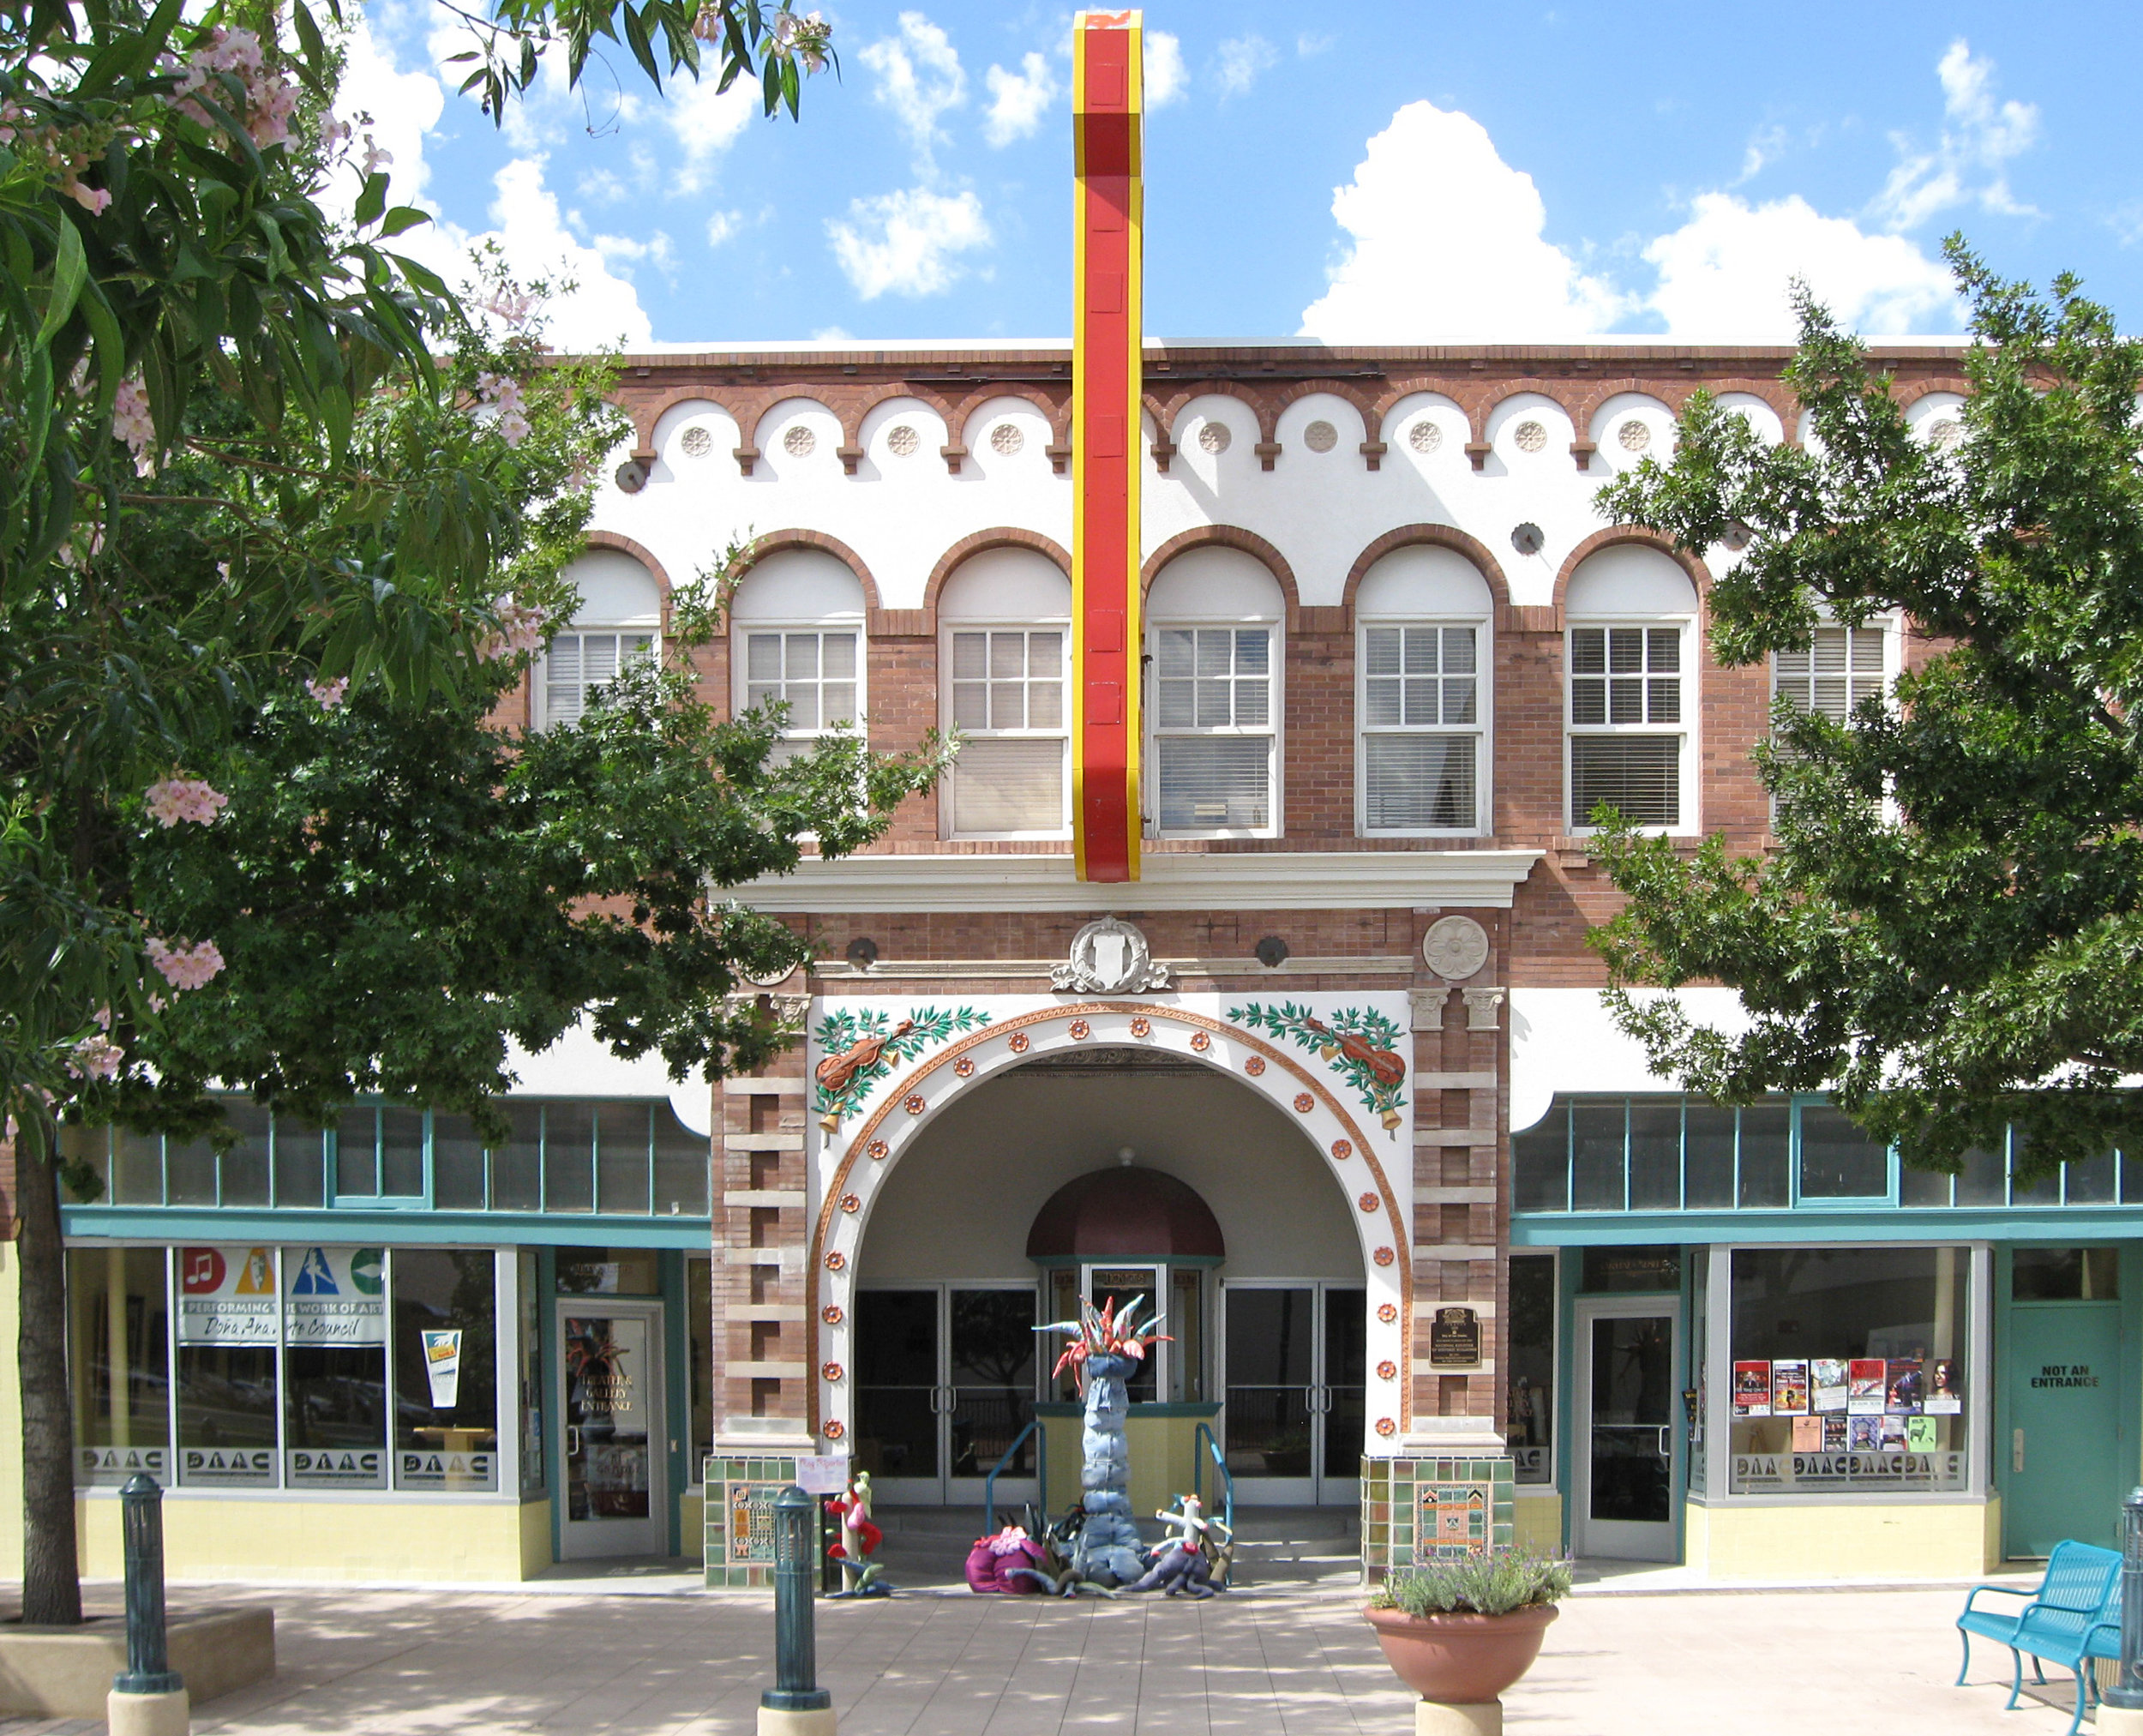
For example, one ripple effect the data will provide novel insight into how events and shows at the Rio Grande Theater (pictured above) draw in people before the show and to what extent they stick around after.

Looking at data over time shows the success of events based on relative attendance and activity scores
The line graph above shows activity downtown over the course of July. Each line shows the pedestrian activity around strategically placed benches and cores. This type of data visualization allows the City of Las Cruces to look back on the month of July and correlate spikes in activity with the events that occurred those days as well as with variables like weather and holidays (note the dip on July 4th).