How Bostonians Have Changed Their Use of Space
Residential neighborhoods are still favored spots though commercial spaces are on the rise.
Data Analysis by: Colin McKenney
—
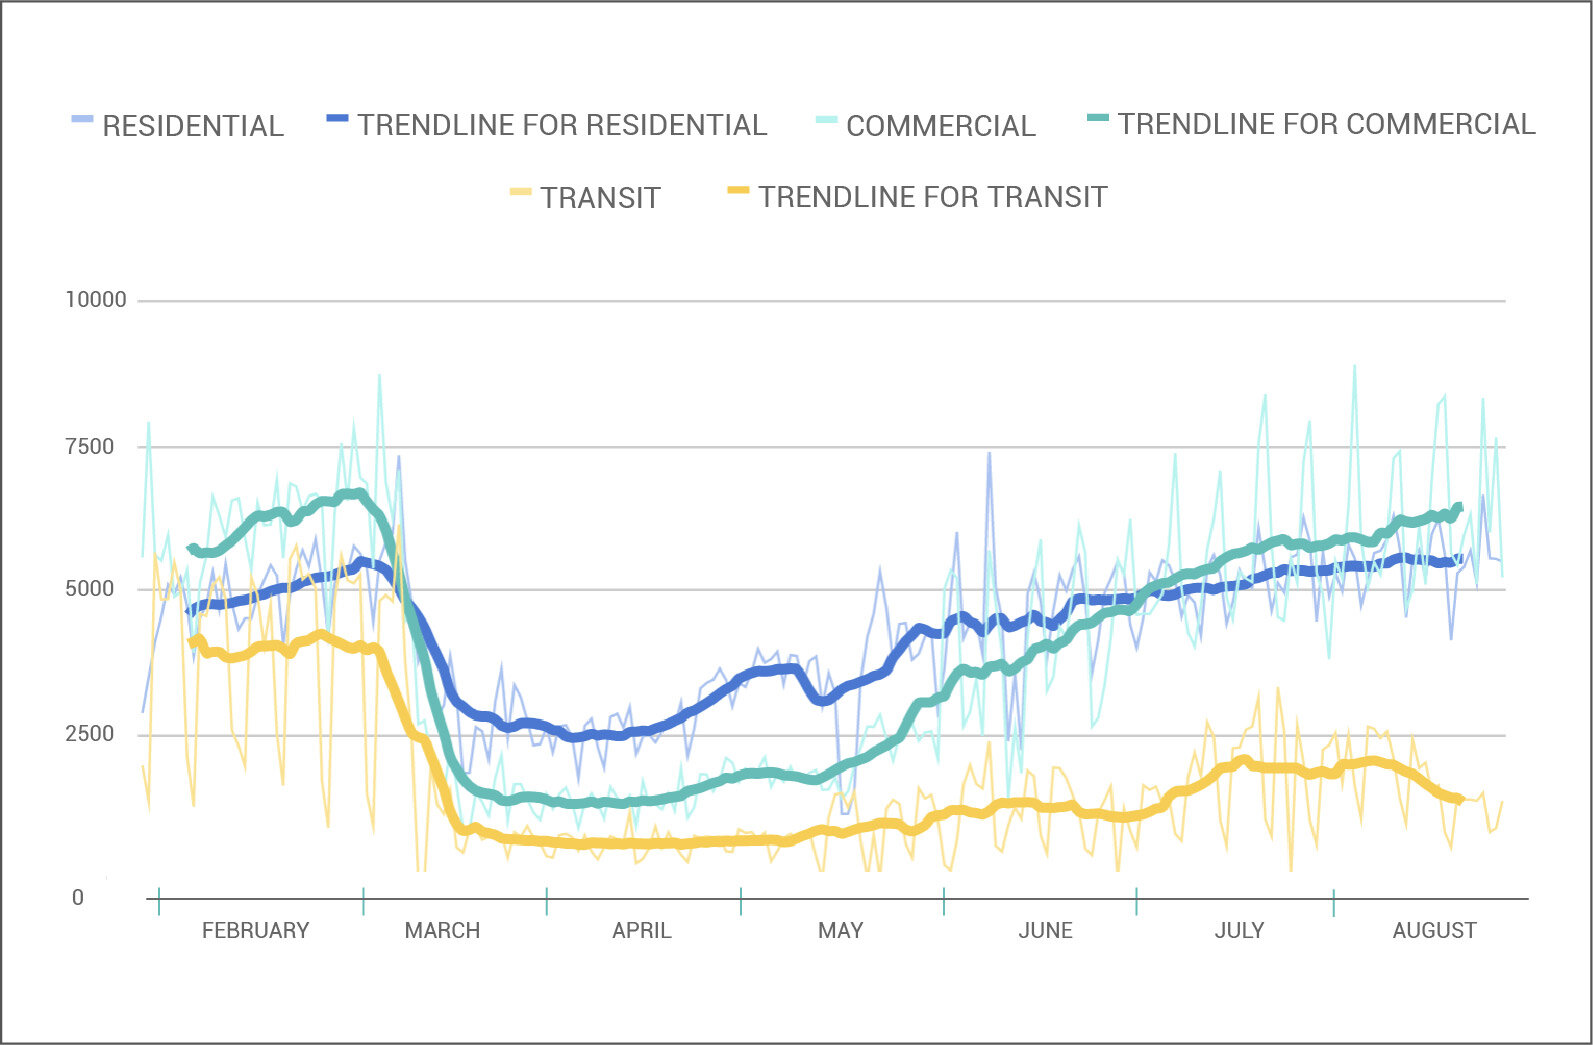
Since March, people’s movement in Massachusetts has changed dramatically. Despite some businesses' fears that pedestrian activity would cease to exist after a concerted effort to stay home in March and April, activity has been on the rise since MA began its first three phases of safely re-opening.
Foot traffic is tracked directly from pedestrian sensors located in Soofa Signs throughout the Greater Boston area. Here’s how different types of spaces have reacted to and recovered from changes caused by COVID-19.
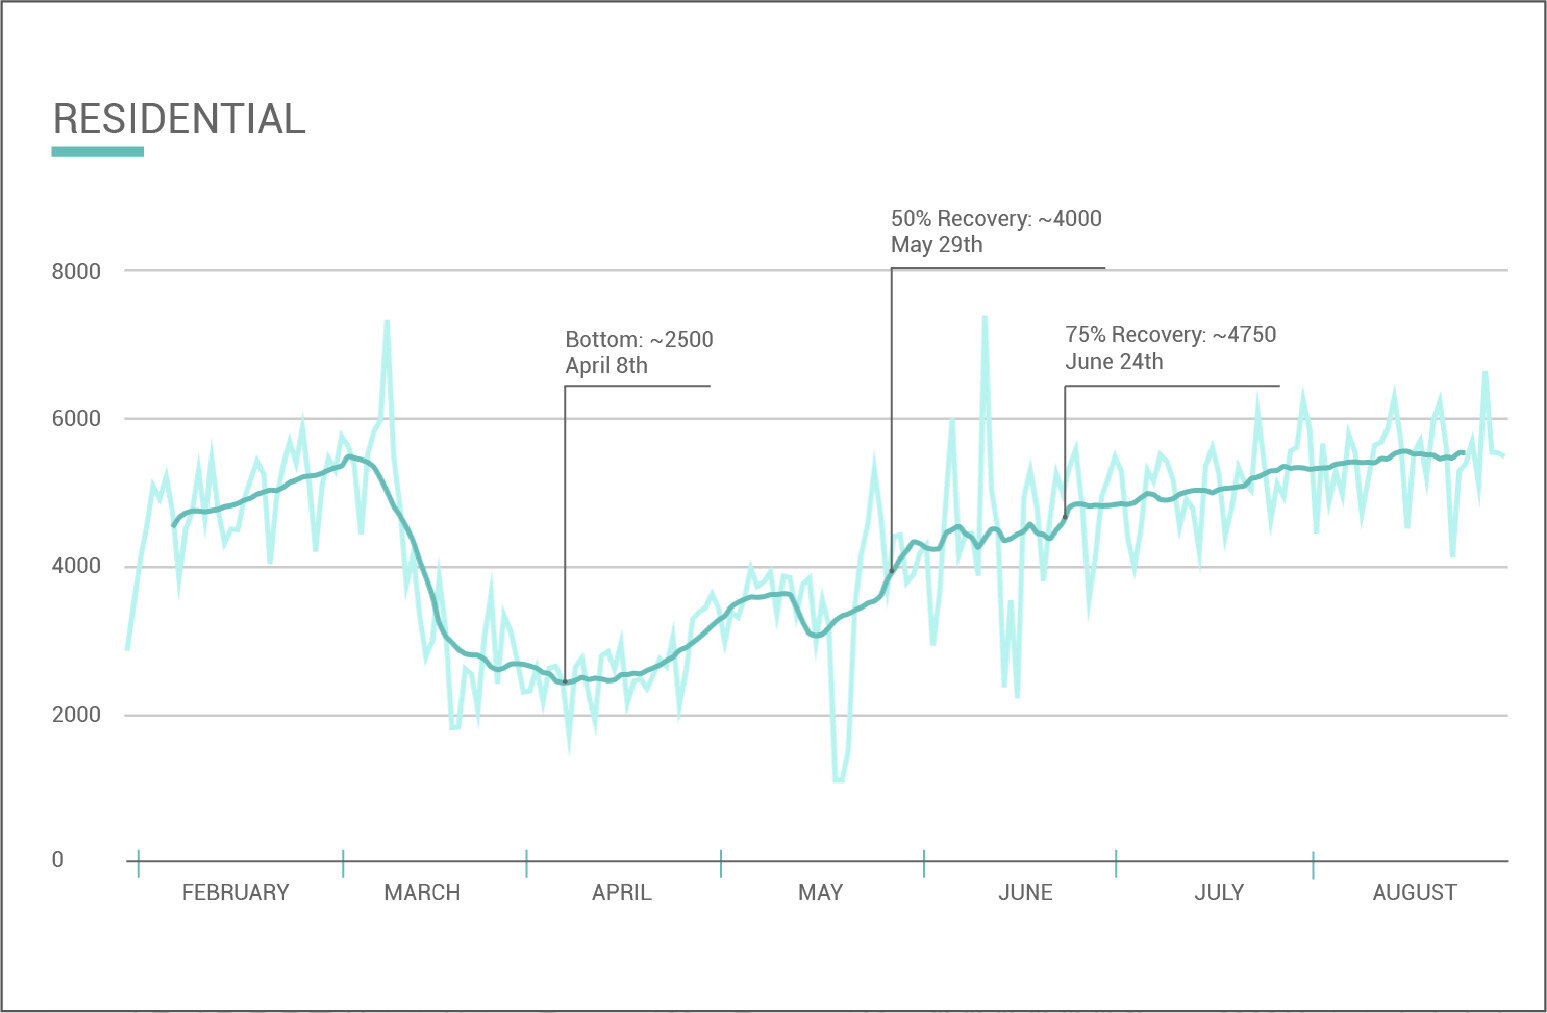
Residential Spaces
Residential spaces bounced back the fastest, and were affected the least (55% initial drop in activity in April).
Residential areas reached 50% recovery by May 29th and 75% by June 24th. In August, residential activity plateaued at 101.8% of pre-COVID activity.
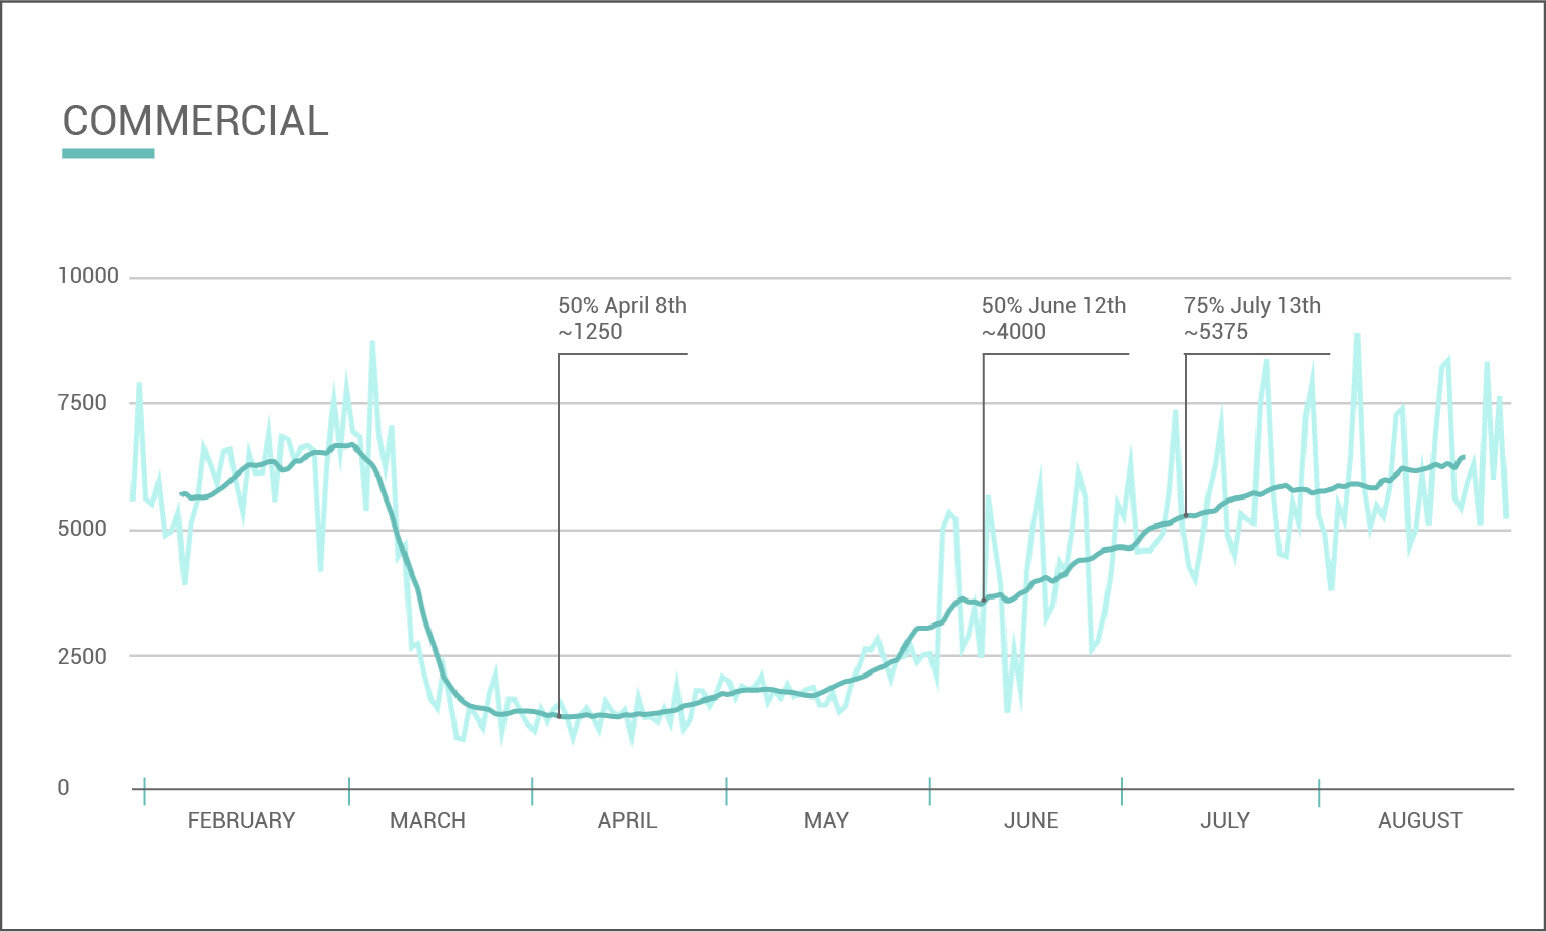
Commercial Areas
Commercial areas suffered the steepest decline of pedestrian activity: 81% in April. These areas achieved a recovery of 75% by July. Data in August indicates that foot traffic is still on the rise in commercial areas, and has not yet plateaued.
The rebound of Commercial spaces is driven by large weekend activity spikes. This indicates current usage of these spaces for leisure activities and shopping, and does not necessarily mean that a majority of people are returning to work yet.
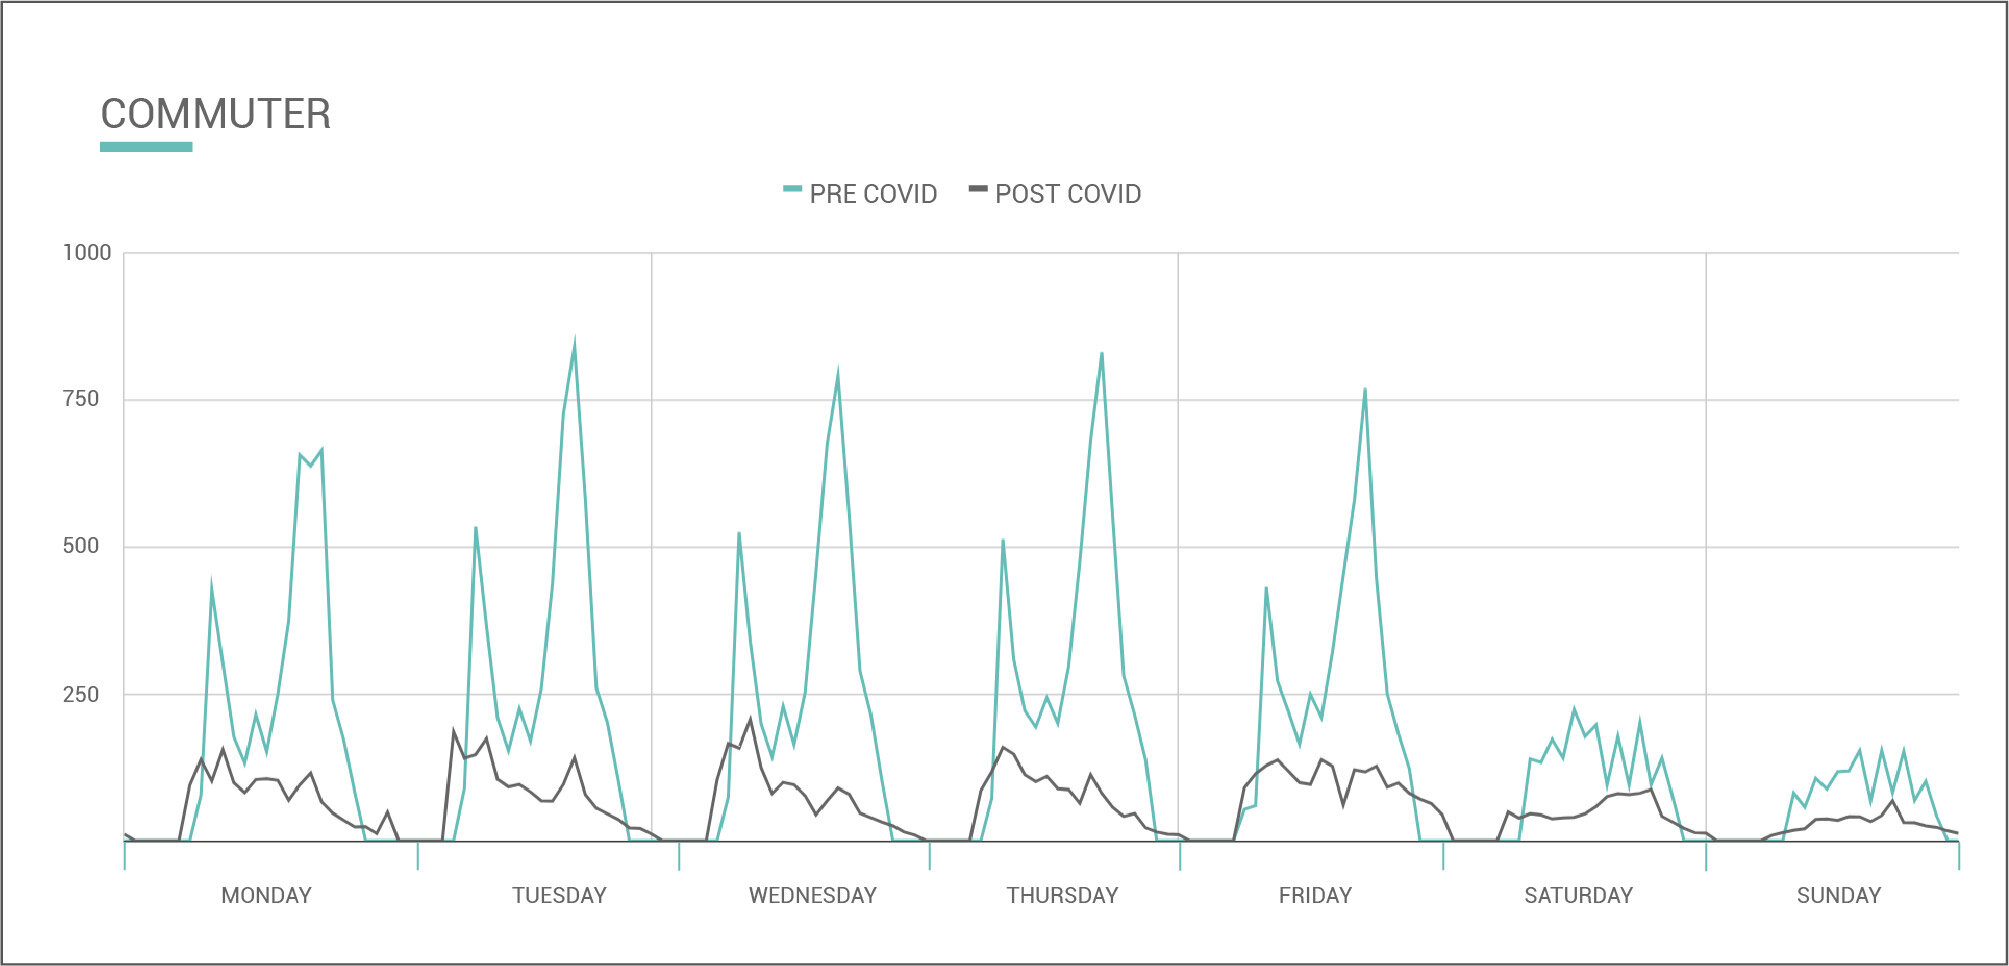
Commuter Activity
Commuter areas are now seeing larger morning spikes in activity, rather than around 3-5pm as was the trend pre-COVID. Commuter areas have seen the least amount of recovery since April, when foot traffic dropped 81%.
As of August, foot traffic has not yet exceeded 50% of the pre-COVID average. We don’t expect to see 100% recovery in heavily used transit spaces until Boston’s working population returns to work fully in 2021, and/or fears regarding the safety of transit have been fully addressed.
Citywide
We expect to see residential, commercial, and commuter areas all plateau in Q4, signaling the start of the “new normal” baseline for activity for the foreseeable future. We expect foot traffic to decrease slightly with colder weather, but also expect to see less seasonal decreases than typical years, as leisure activities trend outdoors, despite the colder weather!