
How and why the Park District of Oak Park, IL is using Soofa Pro Data
“In the first six months, we’ve already been able to spot differences in usage patterns in the four parks where a Soofa Core was installed. And we are starting to see how park visitation is impacted by rentals, holidays, weather, construction, as well as the number of attendees at a special event or number of people that take advantage of temporary offerings like outdoor ice rinks or art installations.”

Bobbi Nance | Senior Manager, Strategy and Innovation, Park District of Oak Park, IL
The Park District of Oak Park is one of Soofa's first smarter parks beta partners, joining our network of innovative park and recreation agencies nationwide in August 2016. The network includes agencies like NYC Parks, Prince George's County, MD Parks and Recreation, Oklahoma City Parks and Recreation, and dozens of other forward thinking agencies. You can read more about the Park District's installation in this Chicago Tribune article and learn more about how they engaged their community with a fun QR code scavenger hunt called SpotTheSoofa.
Project Start Date: August 2016
Location: Park District of Oak Park, IL
Scope: Soofa Core Pro in 4 Park District parks
Goals: Compare pedestrian use of parks to inform capital planning decisions, measure the success of event programming and marketing, and tell a fuller story of how the Park District's parks are used and just how valuable they are.

The Park District of Oak Park demonstrates innovative leadership by using Soofa data to improve its parks for its community
Bobbi Nance, Senior Manager of Strategy and Innovation at the Park District of Oak Park, IL has championed our smarter parks beta project from the beginning. Bobbi has been instrumental in analyzing Soofa data to maximize its benefit for the Park District. As the person responsible for managing innovation projects at the Park District of Oak Park, Bobbi has a tremendous number of opportunities to choose from to execute.
We asked her why she chose Soofa. She went on to explain that, "at any park and recreation agency, the most popular service utilized by the community is open space, including parks and playgrounds. Unfortunately park use is also one of the hardest things for park providers to measure. The technology in Soofa products was appealing to us as a data-driven organization because it allowed us for the first time to have consistent data about how our parks are being used, all while providing the added benefit of free solar-powered charging stations to our park visitors."
Data in raw form provides the Park District flexibility to study how park use is impacted by events, weather, and more
The Park District of Oak Park imports Soofa data in raw form into its agency-wide dashboard. By using Soofa data in its raw form, the Park District is able to analyze correlations including how temperature and events impact park use, and it is able to evaluate the success of different marketing strategies and tactics by knowing how many people come out based on a particular marketing initiative. In addition to exporting in a raw form (via csv or txt file) Soofa data can be visualized in standard reports.
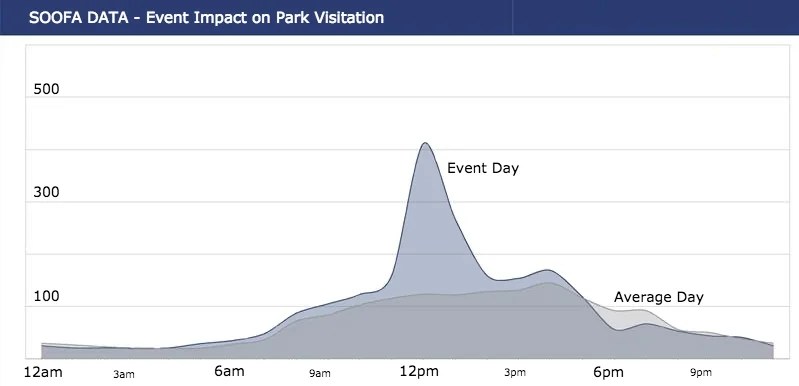
The spike shown on the graph above reflects an event that was hosted in the park. You can see with Soofa's hourly data on park attendance that the event started around 11am and ended around 2pm, as visualized by the dark line on the graph above. The two lines on the graph represent the pedestrian traffic on the current day of the week, in this case Saturday, and the average traffic you would expect to see on a typical Saturday. It is clear that the event attracted far more people, in fact over two times the number of people, that you would expect to see on a Saturday in the late morning to early afternoon. With this data the Park District is able to quantify the success of this particular event and others based on the attendance in a way that would not have been possible without Soofa's data.
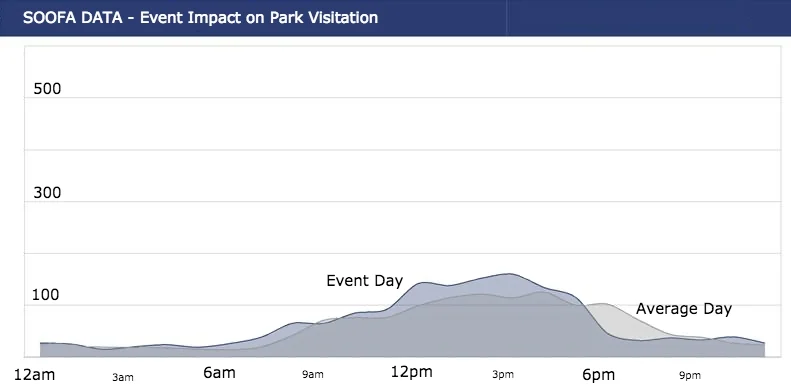
This illustrates how park traffic was impacted on Super Bowl Sunday. You can see above that the dark line on the graph declines rapidly between 5pm-6pm relative to the average traffic the park tends to see on a Sunday, as indicated by the lighter tone line in the background. This dramatic dip in park activity correlates with the start time of the Super Bowl.
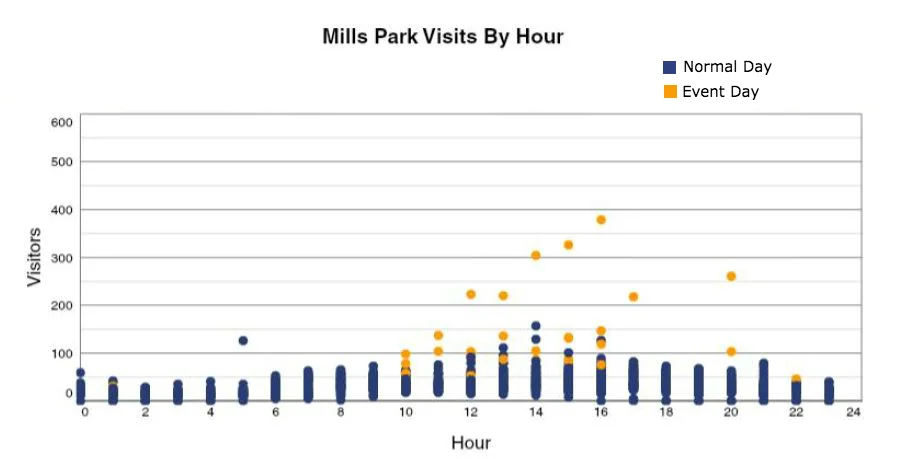
The graph above is analyzing week day traffic in Mills Park, Monday - Friday. The graph is to be read in the following way: the y-axis indicates the number of visitors at Mills Park and the x-axis indicates the hour of the day. The blue dots indicate the number of people seen on a normal weekday from August 1, 2016 through December 31, 2016. The yellow dots indicate special events that happened on a particular day and time of day during the same time period. The Park District now knows how much additional traffic each event drew to Mills Park. With this graph the Park District is able to draw highly valuable conclusions as to what events attracted more people, allowing them to be able to look deeper into what made events successful so they can replicate them in the future.
Soofa data will continue to drive innovation and improve operations at the Park District of Oak Park
The wealth of data gathered by the sensors in the Soofa Core's is only beginning to be tapped into. The Park District of Oak Park intends to explore the following uses of Soofa's pedestrian activity data in the next six months:
Use pedestrian traffic data to improve park operations.
Inform capital improvement schedules based on knowing how often different parks are actually being used, to ultimately save money on excessive improvements.
Become more efficient in offering and pricing permits for events.
Sync up with nearby business improvement districts and share the data to be able to quantify how public programming impacts park use and neighborhood activity in general.
Measure the impact of park improvement projects by knowing how many more people come out to the park after the improvements are complete.
Knowing pilot project goals and aligning stakeholders early accelerated the innovation process and drove successful outcomes
The original idea to bring Soofa to the Park District of Oak Park was initiated in March 2016 by Bobbi Nance to her team via the Park District's internal Wiki page where everyone shares innovative ideas. In just five months later Soofa Core's were being installed in four Park District parks. How did this happen so fast? Some recommendations from the Park District of Oak Park on how to innovative efficiently include:
Figuring out early if you want to start with a pilot project or wide spread deployment and aligning all internal stakeholders accordingly.
Insulate innovation projects from traditional processes and funding sources.
Don't miss out on the value and the opportunity that comes from the innovation itself, like being able to co-develop a product that really meets your needs.